www.BrandLoyalties.comHome of the BrandLoyalties Metrics | ||
| Home | Basic Concepts White Paper | Big Data Video | BrandLoyalties FAQs | Sample Page |
| Symbol | Equity | Percentile Ranking | Price Correlation | Price Correlation Percentile | Industry | IP Scope | YOY Change Percentile | Revenue Correlation Percentile | Event Risk Percentile |
|---|---|---|---|---|---|---|---|---|---|
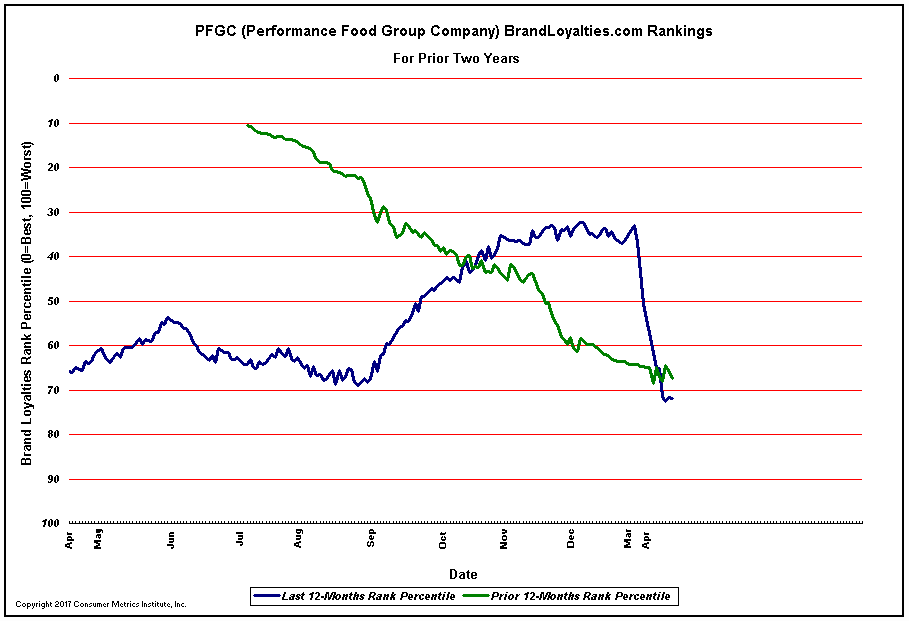
| PFGC | PERFORMANCE FOOD GROUP COMPANY | 72.0% | -- | -- | Food Distributors | US | 49.4% | 39.4% |
| Date | Ranking Percentile | Correlation Coefficient | Correlation Percentile |
|---|---|---|---|
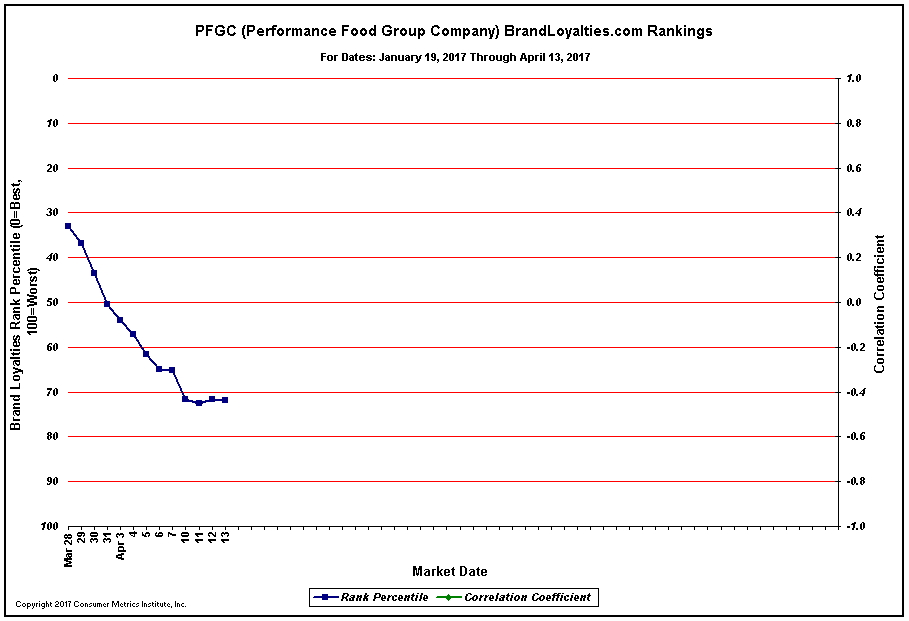
| 03/28/2017 | 33.1% | -- | -- |
| 03/29/2017 | 36.8% | -- | -- |
| 03/30/2017 | 43.6% | -- | -- |
| 03/31/2017 | 50.5% | -- | -- |
| 04/03/2017 | 54.1% | -- | -- |
| 04/04/2017 | 57.1% | -- | -- |
| 04/05/2017 | 61.5% | -- | -- |
| 04/06/2017 | 65.0% | -- | -- |
| 04/07/2017 | 65.2% | -- | -- |
| 04/10/2017 | 71.5% | -- | -- |
| 04/11/2017 | 72.5% | -- | -- |
| 04/12/2017 | 71.7% | -- | -- |
| 04/13/2017 | 72.0% | -- | -- |
| Home | Basic Concepts White Paper | Big Data Video | BrandLoyalties FAQs | Sample Page |